I have a commercial IOT product that I want more control over. Sure, I can control it with the free Android app, but I want my home server to be able to control it, too. This means trying to understand how the app controls it over the network, and attempting to replicate that communication.
This means I have to do some packet sniffing.
Contents
Simple probing
First thing first, we’ll want to figure out what IP address the router has assigned it. This should be as simple as logging on to your router’s configuration web page & finding the device that you don’t recognize. If you happen to run DD-WRT on your router, it might look something like this:
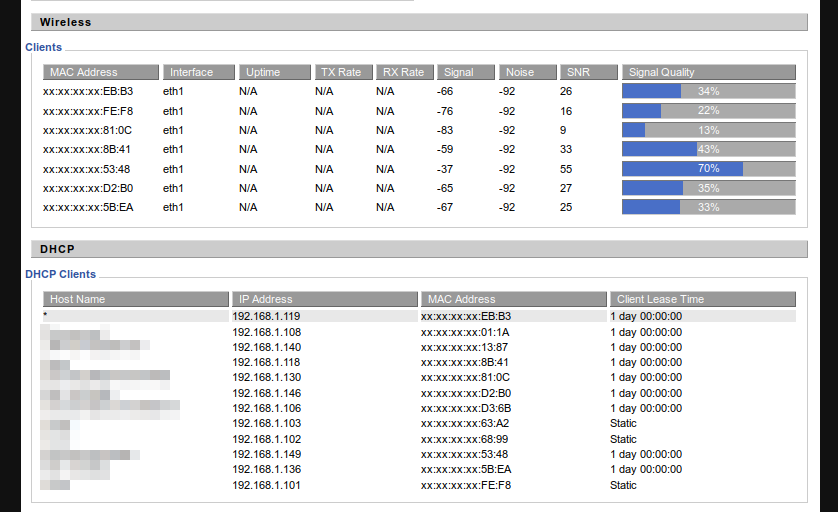
It just so happens that my target device is listed first: 192.168.1.119
The next thing we can do once we know the IP address is do a port scan using nmap. We might get lucky and find that some useful service is exposed.
By default, nmap scans the most common TCP ports:
> nmap 192.168.1.119
Starting Nmap 7.12 ( https://nmap.org ) at 2016-11-25 21:27 MST
Nmap scan report for 192.168.1.119
Host is up (0.0015s latency).
All 1000 scanned ports on 192.168.1.119 are closed
Nmap done: 1 IP address (1 host up) scanned in 7.07 seconds
Alternatively, we can specify which ports to scan. Here, I’m asking it to scan TCP ports 1 thru 10,000:
> nmap 192.168.1.119 -p 1-10000
Starting Nmap 7.12 ( https://nmap.org ) at 2016-11-25 21:28 MST
Nmap scan report for 192.168.1.119
Host is up (0.0023s latency).
Not shown: 9999 closed ports
PORT STATE SERVICE
1932/tcp open unknown
Nmap done: 1 IP address (1 host up) scanned in 53.59 seconds
We managed to get lucky, and find an open TCP port! Let’s connect to it with netcat & see what happens:
> nc 192.168.1.119 1932
Unfortunately, it presented no welcome message, and any commands I tried got no response.
Next, let’s scan the UDP ports to see what pops out. This requires root permissions, and it takes a while. By default, it will increase the time between port probes since it’s not receiving any responses, so we need to add some additional options to speed things along:
> sudo nmap 192.168.1.119 -sU -p 1-20000 --max-scan-delay 150ms --max-retries 2 --max-rtt-timeout 150ms --min-rate 200
Starting Nmap 7.12 ( https://nmap.org ) at 2016-11-25 22:09 MST
Warning: 192.168.1.119 giving up on port because retransmission cap hit (2).
Nmap scan report for 192.168.1.119
Host is up (0.0048s latency).
Not shown: 19995 closed ports
PORT STATE SERVICE
25/udp open|filtered smtp
80/udp open|filtered http
4096/udp open|filtered bre
10619/udp open|filtered unknown
13450/udp open|filtered unknown
MAC Address: 38:2B:78:00:EB:B3 (ECO Plugs Enterprise)
Nmap done: 1 IP address (1 host up) scanned in 199.26 seconds
Again, we can try to connect to these UDP ports with netcat:
> nc -u 192.168.1.119 25
No welcome messages, and no interesting responses to anything I sent.
Time to move along to…
Intercepting traffic out to the wider Internet
High-end routers have a “monitor port” feature. Basically, any traffic that flows through the router will be copied to this port so that the traffic can be analyzed. Unfortunately, consumer-grade routers don’t often have anythign like this.
However, some consumer routers (like the ancient Linksys WRT54GL that I use) can run custom Linux firmware, which can approximate this feature. This post (cached here) describes how to set up some firewall rules so we can observe traffic flowing through our router. The main limitation of this is that we’ll only monitor traffic that’s entering or leaving the internal network, not any traffic that stays on the subnet (because this local routing happens in a dedicated routing chip; it isn’t touched by any Linux software).
An aside: my DD-WRT install is really old, and only supports a weak ssh key exchange protocol. It must be manually enabled like this: ssh -oKexAlgorithms=+diffie-hellman-group1-sha1 root@192.168.1.1
Before adding our rules, there will probably be nothing:
# iptables -t mangle -L

Chain PREROUTING (policy ACCEPT)

target     prot opt source               destination
Chain INPUT (policy ACCEPT)
target prot opt source destination
Chain FORWARD (policy ACCEPT)
target prot opt source destination
Chain OUTPUT (policy ACCEPT)
target prot opt source destination
Chain POSTROUTING (policy ACCEPT)

target     prot opt source               destination
Add our rules, then make sure they’ve been applied:
# iptables -t mangle -A POSTROUTING -d 192.168.1.119 -j ROUTE --tee --gw 192.168.1.102

# iptables -t mangle -A PREROUTING -s 192.168.1.119 -j ROUTE --tee --gw 192.168.1.102

# iptables -t mangle -L

Chain PREROUTING (policy ACCEPT)

target     prot opt source               destination

ROUTE      0    --  192.168.1.119        anywhere            ROUTE gw:192.168.1.102 tee
Chain INPUT (policy ACCEPT)
target prot opt source destination
Chain FORWARD (policy ACCEPT)
target prot opt source destination
Chain OUTPUT (policy ACCEPT)
target prot opt source destination
Chain POSTROUTING (policy ACCEPT)

target     prot opt source               destination

ROUTE      0    --  anywhere             192.168.1.119       ROUTE gw:192.168.1.102 tee
Aside #2: in order to run wrieshark as an unprivileged user, do the following:
> sudo dpkg-reconfigure wireshark-common

#Select Should non-superusers be able to capture packets?  "yes"

> sudo usermod -a -G wireshark your-username-here
Group settings only take effect at the nest login. So, either log out and in again, or run su your-username-here to get a single terminal with the new group applied.
With that in place, we can launch wireshark now. The starting screen should look something like this:
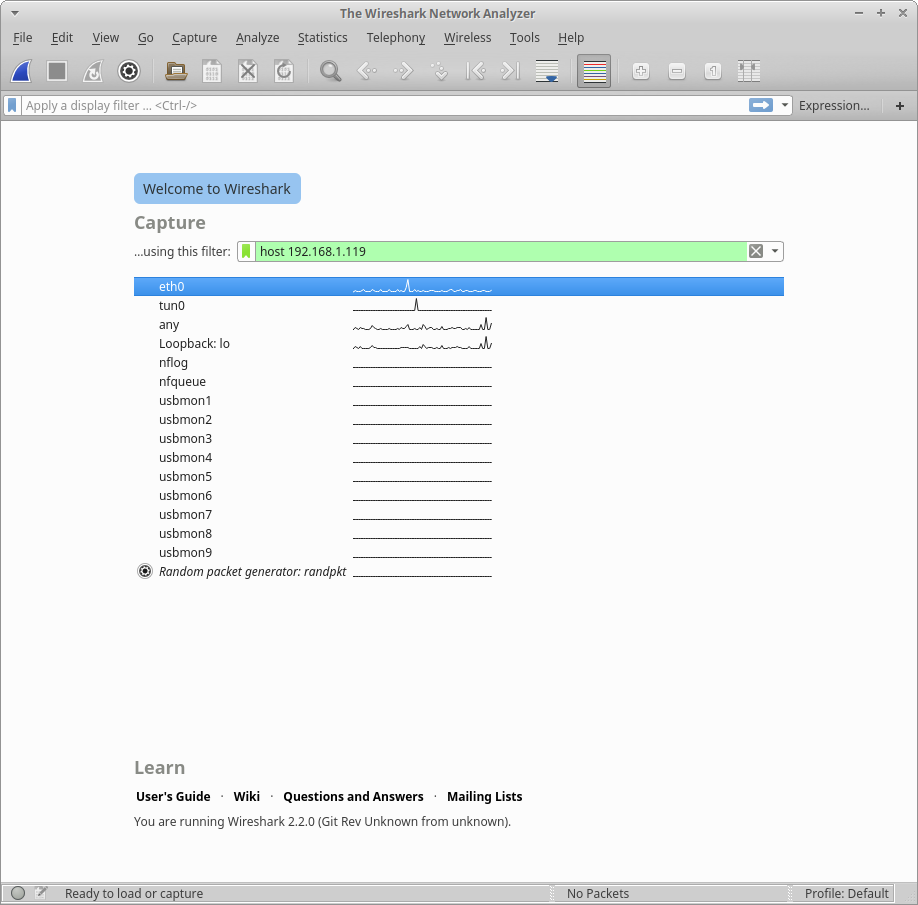
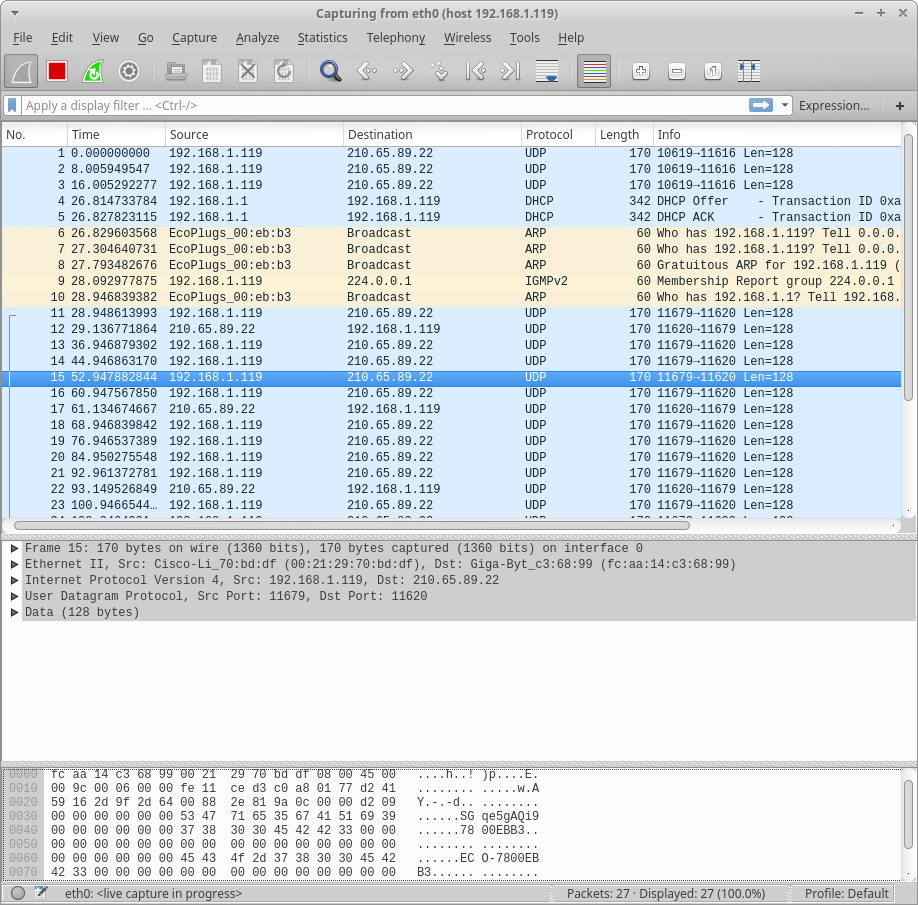
Select the interface you want to monitor (eth0 for me), and enter in an appropriate capture filter (host 192.168.1.119 will capture the packets to and from that IP), then hit enter. It should start capturing packets:
Once you’ve done some interesting activities (restart the unit to observe its initial connections, perform come operations, etc), you can press the red square to stop the capture. At this time, you can dig into the individual packets, or save the capture off to analyze later.
Now that we’re done with the monitoring, we should delete the firewall rules (and confirm that they have been deleted):
# iptables -t mangle -D POSTROUTING -d 192.168.1.119 -j ROUTE --tee --gw 192.168.1.102

# iptables -t mangle -D PREROUTING -s 192.168.1.119 -j ROUTE --tee --gw 192.168.1.102

# iptables -t mangle -L

Chain PREROUTING (policy ACCEPT)

target     prot opt source               destination
Chain INPUT (policy ACCEPT)
target prot opt source destination
Chain FORWARD (policy ACCEPT)
target prot opt source destination
Chain OUTPUT (policy ACCEPT)
target prot opt source destination
Chain POSTROUTING (policy ACCEPT)

target     prot opt source               destination
Intercepting WiFi traffic
Of course, you may want to see more of the traffic that’s being sent by the device. How is it interacting with other devices on your home network? How does it communicate with the cell phone app when the “cloud” feature is disabled?
This one is tricky, mostly because we’ll need a WiFi adaptor that allows us to capture packets that aren’t intended for us. I tried a few laptops that I had laying around, and none of them seemed to work as well as I had hoped. However, I found that this USB WiFi adaptor works pretty well for me.
Unfortunately, I don’t think there’s a way to directly capture with wireshark (if there is, please let me know!). I’ll use airodump-ng to dump the traffic, then use wireshark to analyze it afterwards.
First, we should check if there are any programs running that might interfere with our capture:
> sudo airmon-ng check

Found 2 processes that could cause trouble.

If airodump-ng, aireplay-ng or airtun-ng stops working after

a short period of time, you may want to kill (some of) them!
PID	Name

1005	avahi-daemon

1020	avahi-daemon
If you want, you can use sudo airmon-ng check kill to terminate these processes. I’ve found that these avahi-daemon processes don’t cause problems. If you’re running NetworkManager, you will want to stop that with this command: sudo service NetworkManager stop
Next, we need to put the WiFi adaptor into monitor mode, so it will just listen to all packets:
> sudo airmon-ng start wlan0

Found 2 processes that could cause trouble.

If airodump-ng, aireplay-ng or airtun-ng stops working after

a short period of time, you may want to kill (some of) them!
PID Name
1005 avahi-daemon
1020 avahi-daemon
Interface	Chipset		Driver

wlan0		Unknown 	rtl8192cu - [phy0]

(monitor mode enabled on mon0)
This creates a virtual mon0 interface which is actually the one we’ll capture on (instead of wlan0)
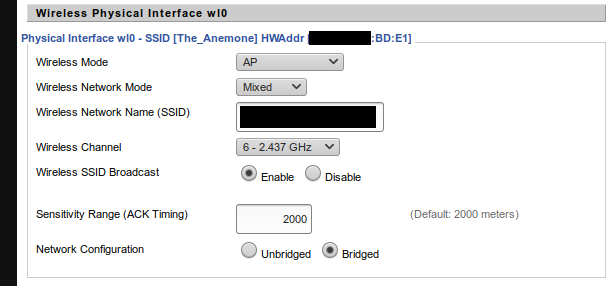
Now, we’ll need some information about our WiFi network. Specifically, the BSSID (hardware address of the access point), and which WiFi channel it’s using. DD-WRT gives me this information on the “Wireless” tab:
Using that information, we’ll run the following command:
sudo airodump-ng -c 6 --bssid xx:xx:xx:xx:BD:E1 -w dumpfile mon0
Where:
-c 6is the WiFi channel we’re listening on--bssid xx:xx:xx:xx:BD:E1is the hardware address of the access point (the real hardware address…no “x”…that’s just to censor my information-w dumpfileis the filename where the captures packets are writtenmon0is the virtual interface that we created with airmon-ng
While this command is running, it will print various commands to the screen. When you think you’ve captured what you need, terminate the capture with ctrl+C.
It is important that this capture observes the device-in-question negotiating its initial connection to the access point. This can obviously be forced by power-cycling the device, but you may also be able to use aireplay-ng to send “deauth” packets that would cause the device to re-negotiate.
Now that we’ve completed the capture, we’ll need to set up wireshark to be able to decrypt it.
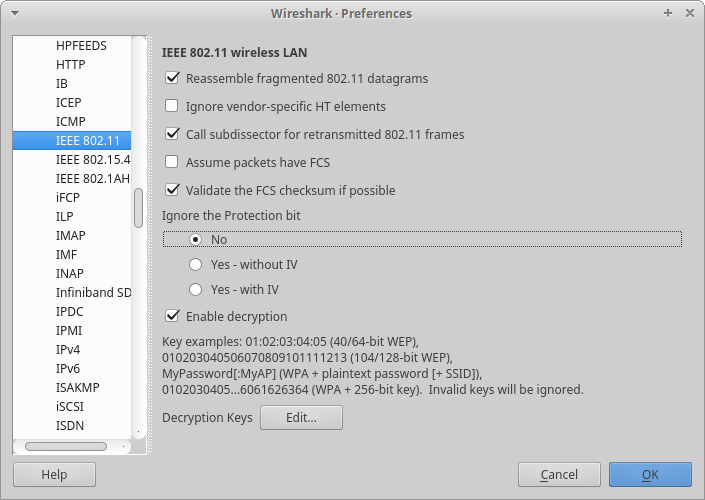
Click on Edit->Preferences..., then navigate to the Protocols->802.11 page. It should look like this:
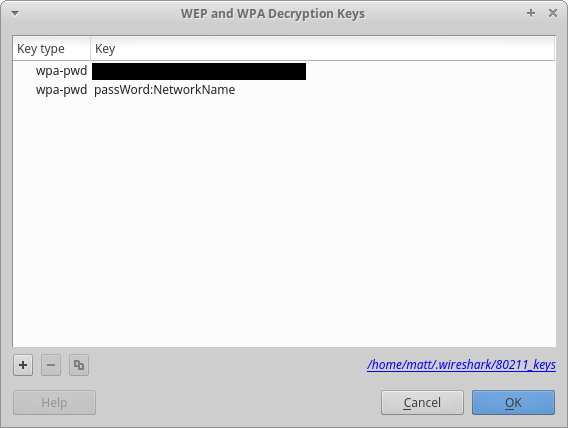
Here, click on Edit… to open this window, and add your WiFi credentials:
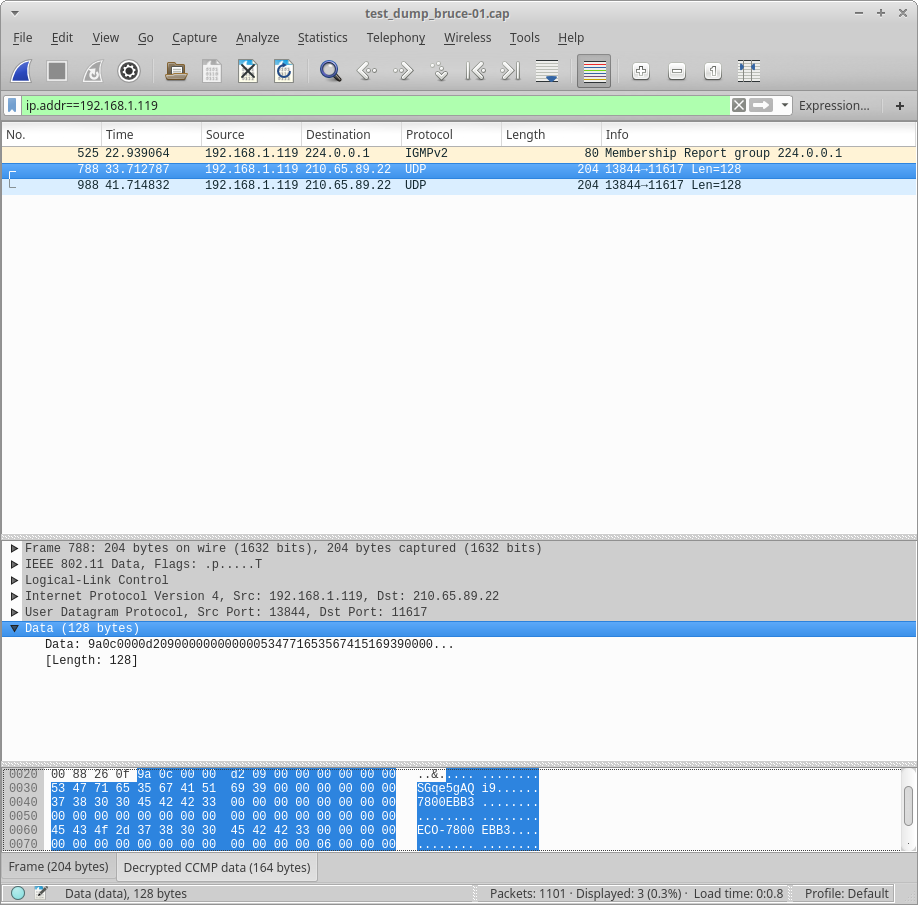
Once that’s done, you can open the capture file that was created by airodump-ng, and you should be able to see the decrypted traffic (here I’m using a display filter of ip.addr==192.168.1.119 to focus on the traffic to the device I care about):
Once you’re done with the capture, disable the monitoring interface:
> sudo airmon-ng stop wlan0
Also, if you disabled NetworkManager earlier, you’ll want to re-enable it like this: sudo service NetworkManager start