When developing my Valentine’s day puzzle box, I found myself really wanting to single-step through some code to figure out where things were going wrong. Fortunately, the STM32F3 Discovery board that I was using supports on-chip debugging. Unfortunately, it wasn’t already integrated into the template that I was using for the project.
This guide to the STM32F3 (also posted on hackaday) has some information about debugging, but it wasn’t immediately clear to me what was going on. I eventually figured out that they were running OpenOCD in the background, then running a GDB session and telling it to attach to the port that OpenOCD had opened:
shell> openocd -f /usr/local/share/openocd/scripts/board/stm32f3discovery.cfg &
shell> arm-none-eabi-gdb
(gdb) target remote localhost 3333
(gdb) file a.out
(gdb)
This worked…kind of. GDB seemed to connect to OpenOCD, but I couldn’t use any useful GDB commands. I finally found the relevant OpenOCD documentation, and things started to come together:
shell> openocd -f /usr/local/share/openocd/scripts/board/stm32f3discovery.cfg &
shell> arm-none-eabi-gdb main.elf
(gdb) target remote localhost:3333
Remote debugging using localhost:3333
...
(gdb) monitor reset halt
...
(gdb) load
Loading section .isr_vector, size 0x188 lma 0x8000000
Loading section .text, size 0x4648 lma 0x8000188
Loading section .data, size 0x4bc lma 0x80047d0
Start address 0x80044dd, load size 19596
Transfer rate: 18 KB/sec, 4899 bytes/write.
(gdb) continue
Continuing.
...
This worked much better. Since the chip was halted, GDB responded to commands the way I expected. I was able to set breakpoints, single-step, print variable values…everything was great, but it was still too much repetitive typing to get it all set up.
The solution was twofold. The same OpenOCD documentation page describes how GDB can run the OpenOCD command itself:
target remote | openocd -c "gdb_port pipe; log_output openocd.log"
I also found this in the GDB man page:
       -x FILE, -command=FILE
              Execute GDB commands from file file.
Combining these meant that I could just have a list of commands in a file that would get GDB all set up:
shell> cat gdb_cmds
target remote | openocd -f /usr/share/openocd/scripts/board/stm32f3discovery.cfg -c "gdb_port pipe; log_output openocd.log"
monitor reset halt
load
shell> arm-none-eabi-gdb -x gdb_cmds main.elf
...
(gdb)
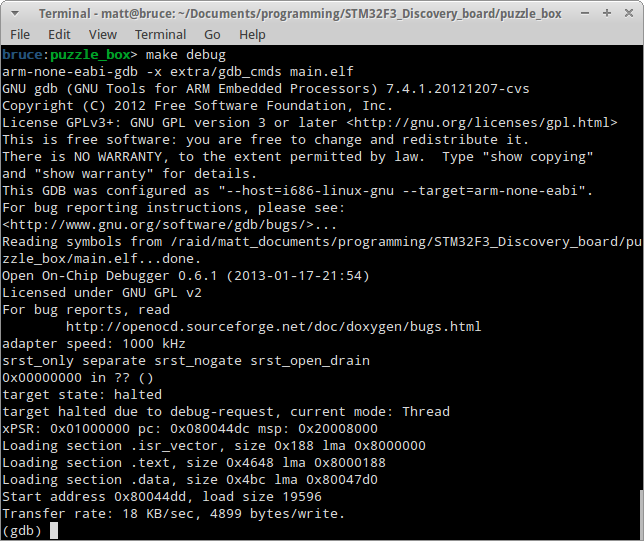
And, just to make things even easier, I added a debug rule to the Makefile:
debug: $(PROJ_NAME).elf
        $(GDB) -x extra/gdb_cmds $(PROJ_NAME).elf
Now all I have to do is type make debug, and GDB starts up and initializes the board without me having to think about it!
You can find my Makefile here, and the gdb_cmds file here. (Or look at this branch for the STM32F0 Discovery board.)